15. Reports
Reports are very important tool when findings, conclusions and situations need to be communicated. There are several report topics on the menu, for different purposes.
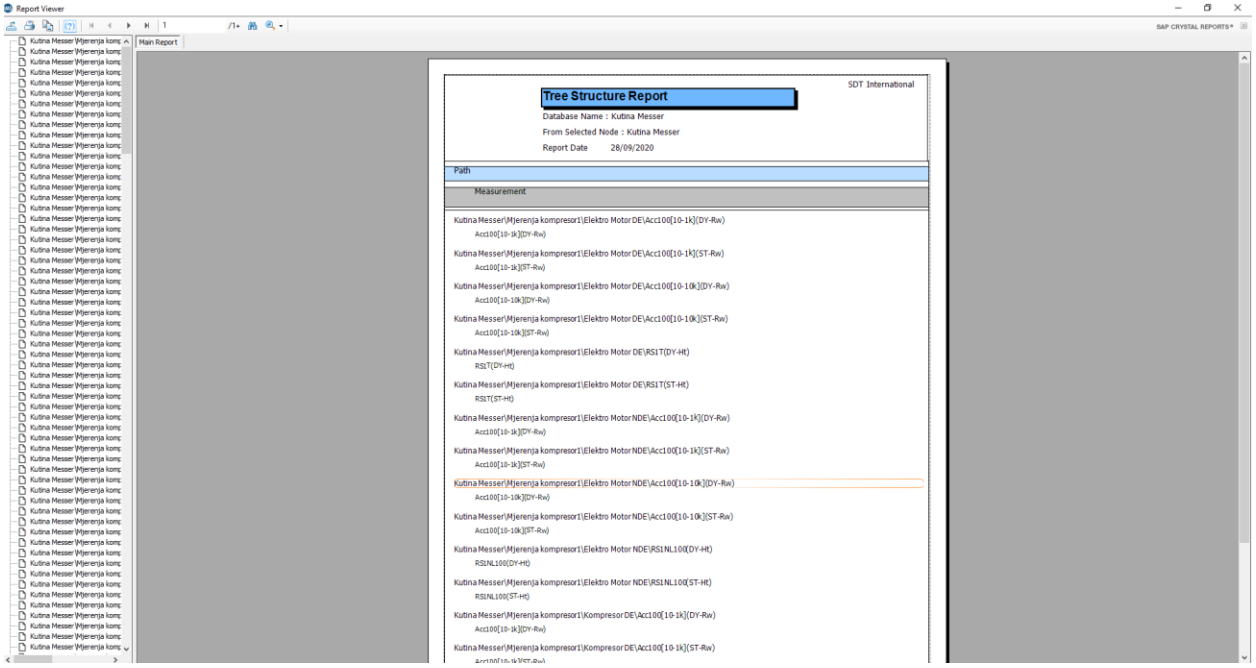
15.1. Tree Structure Report
Only the Report of the Tree Structure pertaining to the Database currently open is accessible. If you want to generate the Report of another Tree structure, please first open the regarding Database.
Select the menu Reports / Tree Structure.
Following window is displayed:

You may prefer to generate a Report of the Entire Tree structure or a Report starting from the Current Selected Sub-Tree, by ticking the appropriate button.
For the format of the Report, you can choose between Text File, XML File and Formatted Report.
You can also insert the content of the Report inside the Clipboard.
Click Ok to generate the report.
15.2. Alarms Report
Alarms are common to all Databases. Therefore, you can include any chosen Alarm in the Reports, whatever the currently open Database.
Select the Menu Reports / Alarms.
The following windows is displayed:

To activate the filter, use CRTL+F.
The Report will show or hide the measurements’ locations concerned, by ticking or not the regarding check box.
For the format of the report, you can choose between Text File, XML File and Formatted Report.
You can also insert the content of the Report inside the Clipboard.
Click Ok to generate the report.

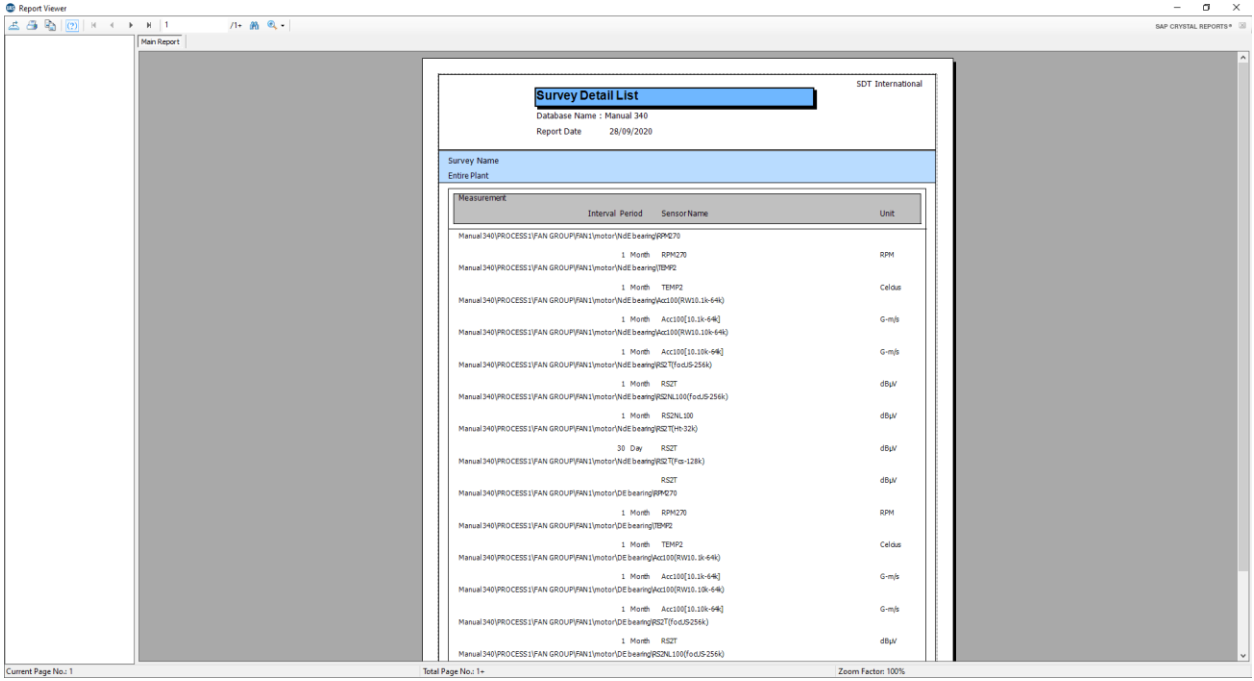
15.3. Work Orders/Surveys Report
The software offers the possibility to generate a report of: The last survey uploaded in a specific SDT170.
Only the Surveys Reports pertaining to the Database currently open are accessible.
If you want to generate a Report created in another Database, please open first.
Select the Menu Reports / Work Orders/Surveys / SDT270/LUBExpert (or SDT340) Work Orders/Surveys.
The following window is displayed:
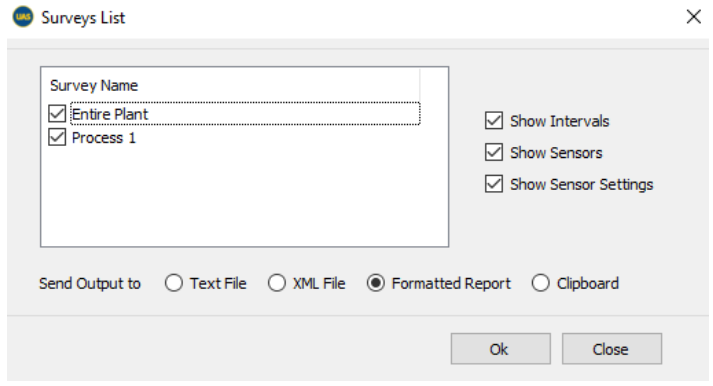
You can decide to show, or hide, in the Report, the used Intervals, the Sensors, and the Sensor Settings, by ticking, or not, the regarding check boxes.
Click Ok to generate the Report.
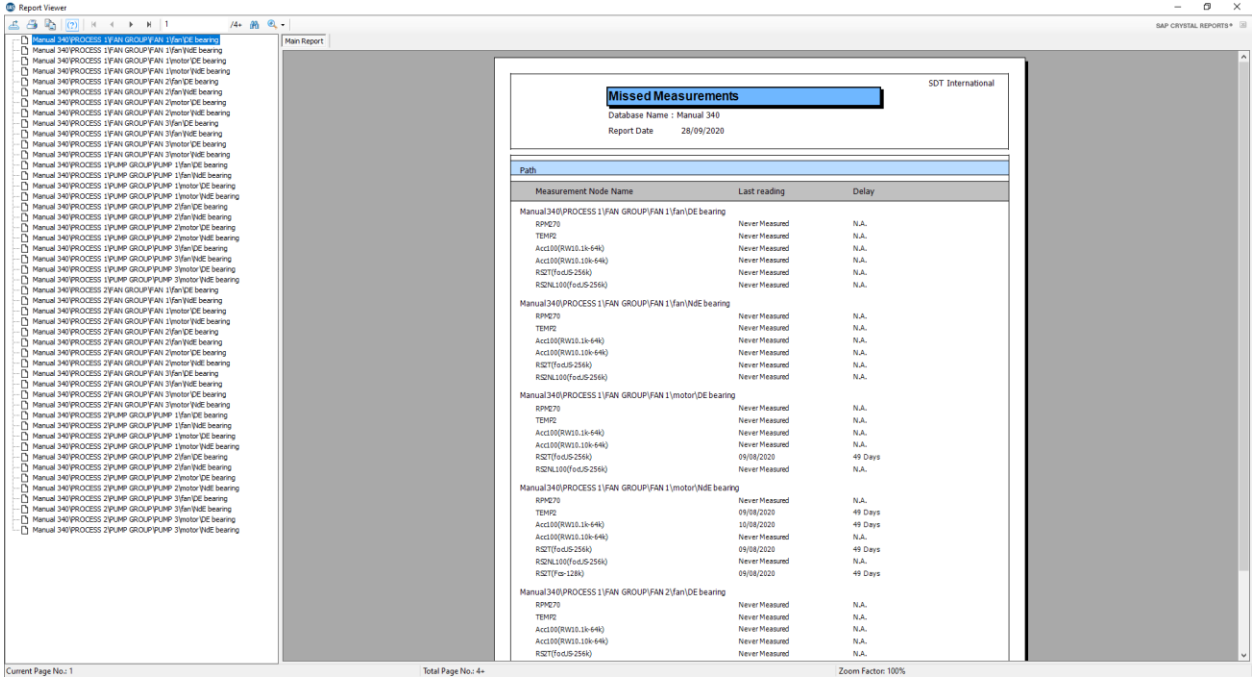
15.4. Missed Measurements Report
Select the menu Reports / Missed Measurement Report.
The following window is displayed:
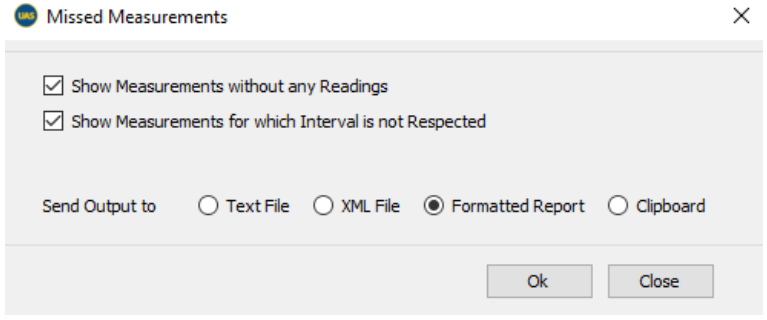
The Report will show, or hide, the Measurements without any Data and the Measurements for which the data collection interval is exceeded, by ticking or not the regarding check boxes.
For the format of the report, you can choose between Text File, XML File and Formatted Report.
You can also insert the content of the Report inside the Clipboard.
Click Ok to generate the Report.
5.5. Measurement Details Report
This Report provides a list of the data recorded for selected measurements, from a range of dates.
Select the menu Reports / Measurement Details.
The following window is displayed:

You can refine your search by selecting a Data Range.
Then click the button XML Export or the button View Report.

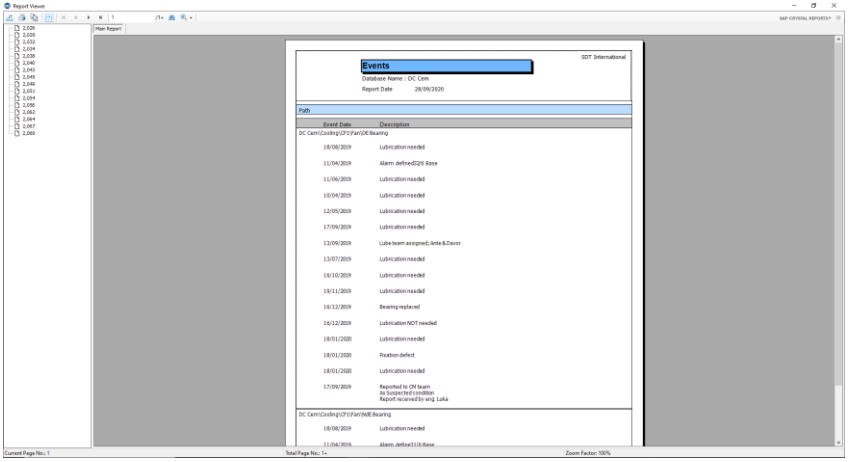
15.6. Events Report
This Report provides a list of the events recorded for parent nodes of Measurements, called Measurement Points, from a range of dates.
Select Reports / Event.
The following window is displayed:
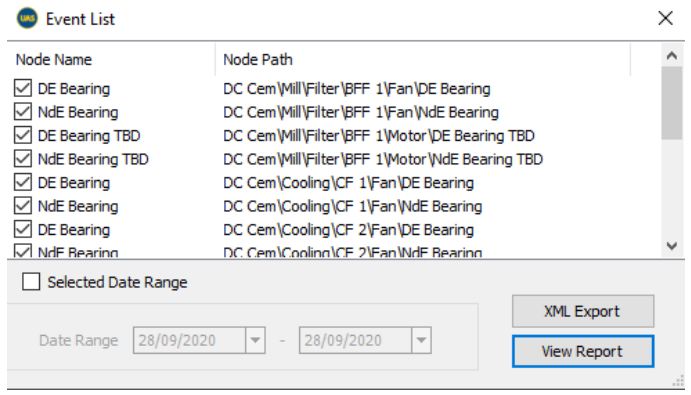
You can refine your search by selecting a Data Range.
Then click the button XML Export or the button View Report.
15.7. Lube Report
Specific report for LUBExpert functionalities is explained in detail in the LUBExpert Manual.
15.8. Asset Condition Report
The Asset Condition report is fully customizable report that includes all necessary information. It is ideal tool for all involved: end user, service provider, CM technician or engineer, Reliability team, management. The report contains all information already available in UAS3, as well as pre-defined fields to enter conclusions such as condition, recommendations, situation, description, criticality and other.
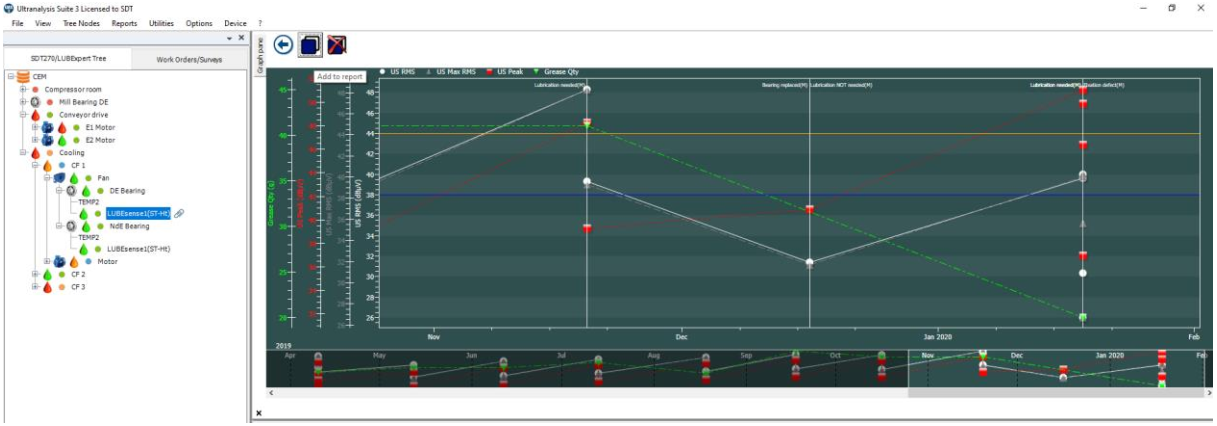
Creating a report is fast, easy, and very intuitive. Once you decide what you want to report (what asset, group of assets, or only measurement point), select the graphs you want to include in your report (if any):

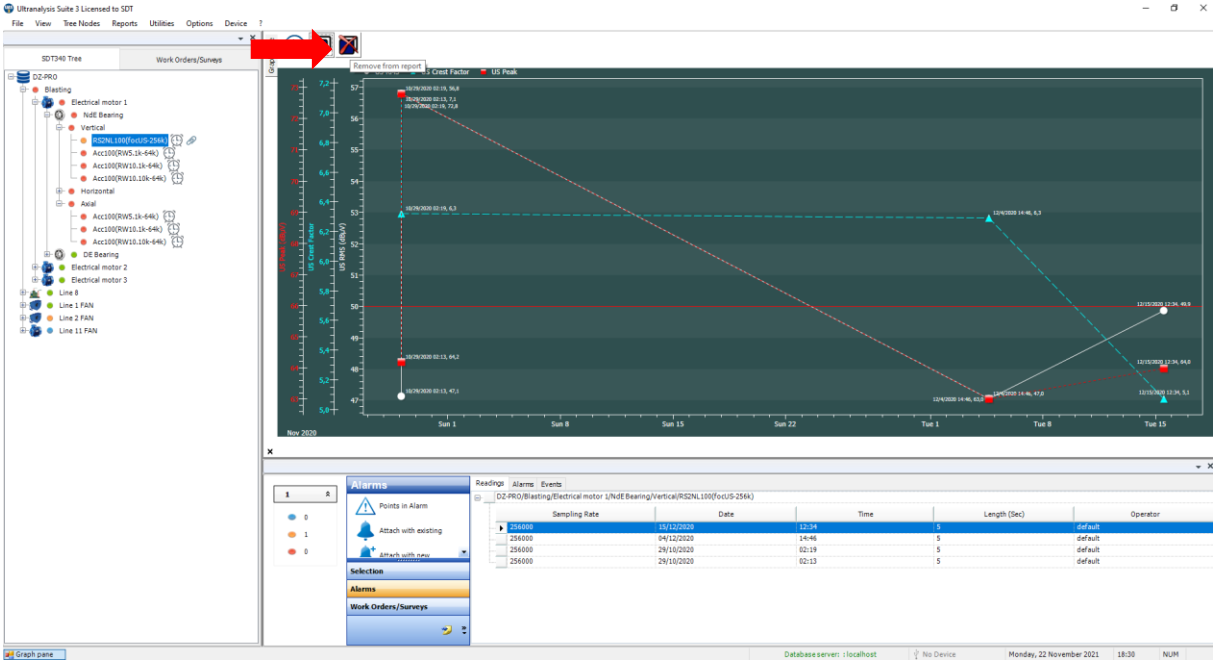
Select the measurement point, the graph, and enlarge it:

To add a specific graph to the report, simply select the button “Add to report”. The selected graph will be included in your report once you enter all the other information.
To remove the graph from the report, in case you changed your mind, or it was added by mistake, use the button “Remove from report”.
You can do the same with all graphs in you UAS3: TWF & Spectrum for both Ultrasound and Vibration, Temperature, RPM, as well as with all graphs specific to LUBExpert.

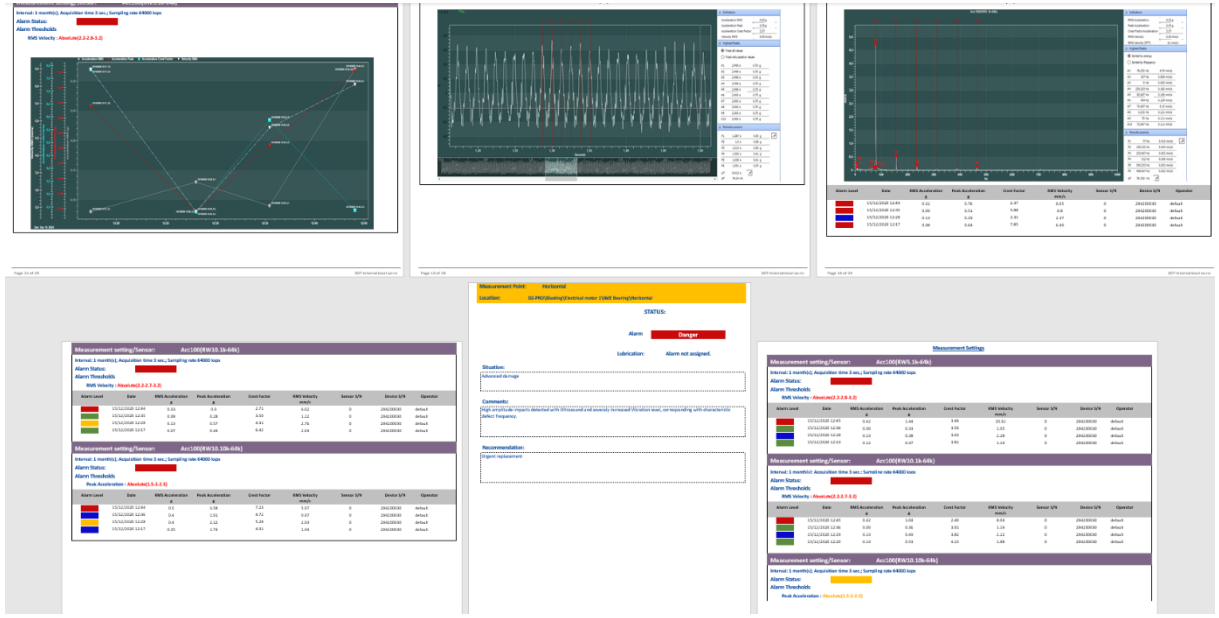
Once you set cursors in your graph and add it to report, the graph will be added with cursors and numeric descriptors, for all cursors and markers, disregarding if cursors are saved or not.

There is no limitation on the number of graphs to be added to the report for each specific measurement point, or altogether. If you add several TWF and Spectra (as an example) from one measurement point, they will be displayed chronologically, newest first, TWF and corresponding Spectrum one after another.

TWF and Spectra of June 30, 2021, Line 2 FAN/Motor DE

TWF and Spectra of September 17, 2021, Line 2 FAN/Motor DE: same measurement point
All graphs will be displayed exactly as you set them (color, options, zoom …).
Note
The small paperclip icon next to the measurement settings (sensor level) indicates that this node contains graph(s) selected for reporting.

Important
Once you switch to another tree structure, another folder or restart your UAS3, graphs you selected for reporting will be de-selected.
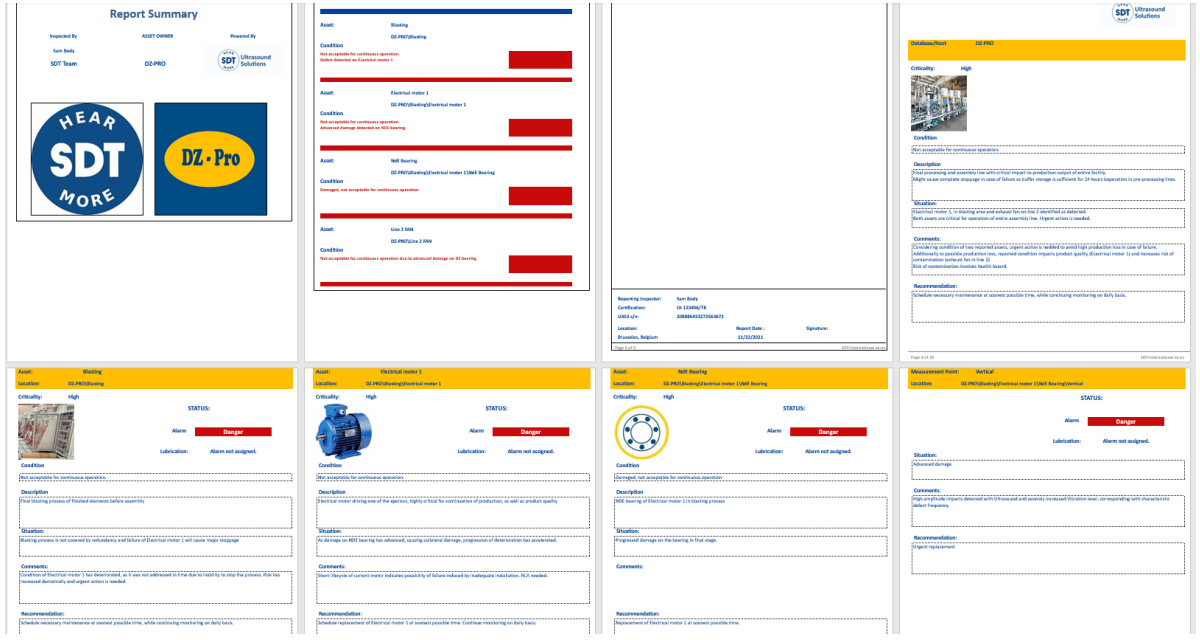
Apart from the selected graphs, the report will display all measurement data, alarms settings, alarm status, measurement settings like interval, acquisition time, sampling rate, software license number, sensor serial number, instrument serial number, operator name. All historical data will be displayed unless otherwise set in report settings (selected date range).
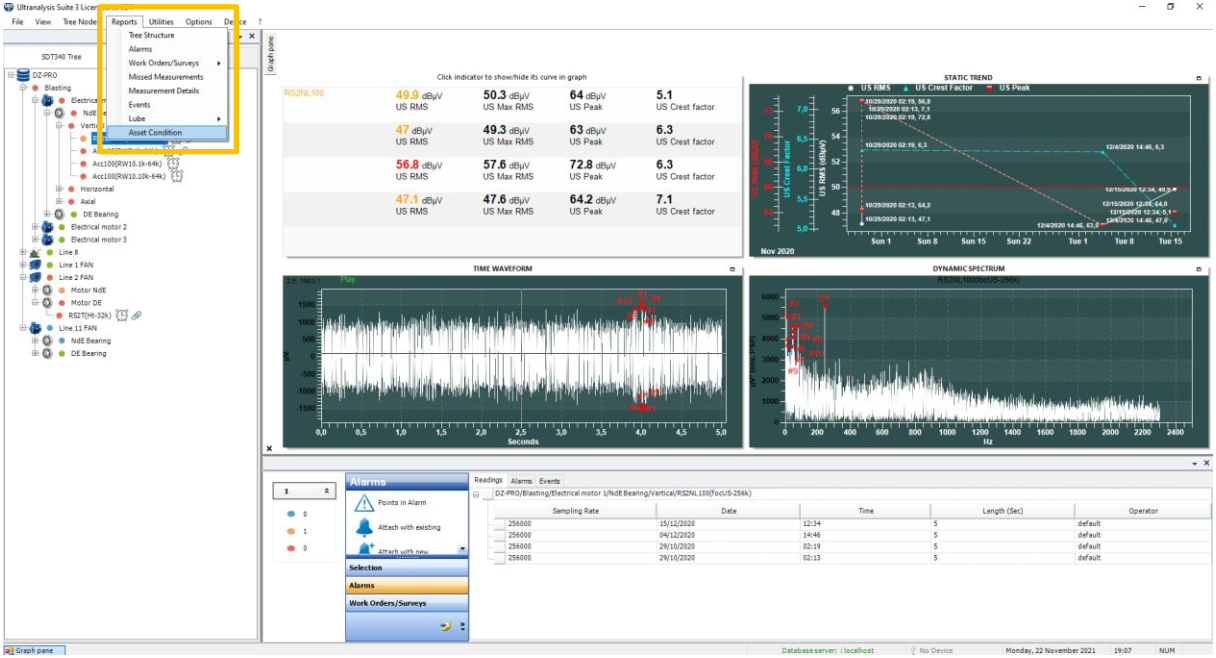
Once you have selected all the graphs you want to display, select “Reports” in the top toolbar, and select “Asset Condition”:
The report settings menu will open:
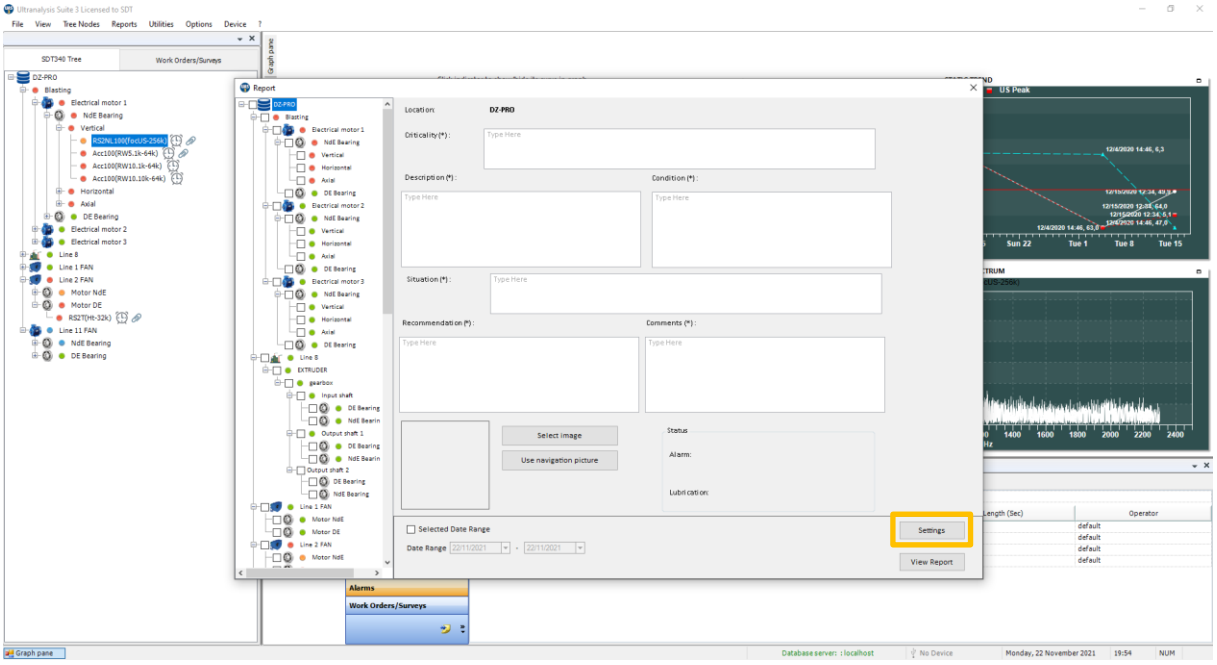
Now, select “Settings” in the bottom right corner of the report menu to enter basic information:

Enter all the necessary data and select “Save and Close” in the bottom right corner. The information you have entered in the basic settings will be displayed in the report.
Next, select the assets and measurement points you want to report. Simply check the box and the selected node will be included in the report. Selecting a node will include all child nodes automatically, but you can de-select some of them individually. Another way to go is to select the exact point, and all parent nodes will be selected automatically. You cannot de-select the parent node, as the report must show the path of the system/assets/component/part…measurement point.

Note that the graphs you have selected for reporting will only be displayed if the node they belong to is selected for reporting, of course.
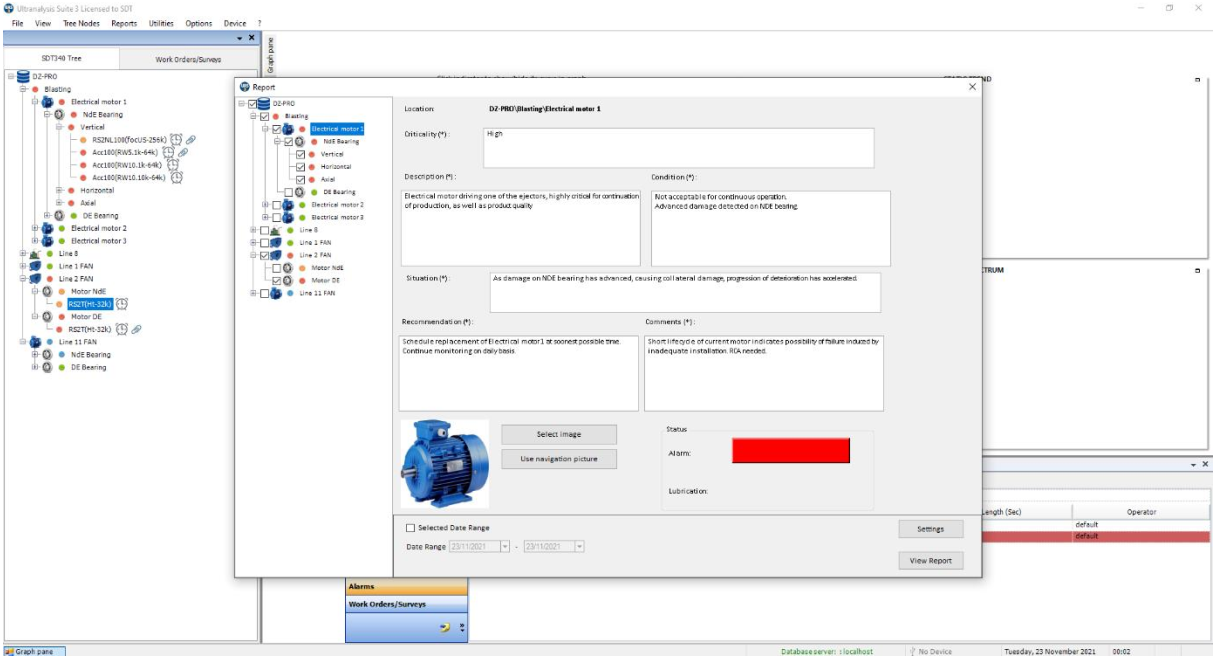
Next, select each node and enter your report content (your conclusions, diagnosis, recommendations, asset condition, descriptions). Here is the example:

For database root DZ-PRO, in this example: finishing and assembly line; you can enter all necessary data, your findings and conclusions, to move on to the specific process and assets it contains:

In this case, blasting process, followed by the assets:
Electrical motors, measurement points and measurement settings.

Or in continuation, Line 2 Fan
Note
If you close the report menu at this stage, all data you entered will be saved even if you change the tree structure, folder, or restart UAS3. Once you open that particular tree structure and Asset Condition report, the data will be there.
If you close the report menu, you can go through your tree structure and add more graphs or remove graphs you do not want, and your report preparation will be updated.
Once you are done with your report, select “View report” in the bottom right corner:

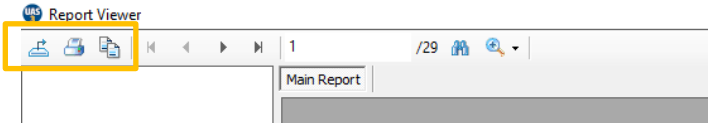
Your report will be displayed in the Report Viewer, and you can make a final check before exporting or printing it.

In the top left corner, you can choose to copy the currently displayed page, print the entire report, or export it in different formats:
Your report is completed!
When reporting LUBExpert data, there is no difference in the settings. You will select all graphs you need, all measurement points you need, enter your conclusions and recommendations and generate the report:
Static trend with all data,
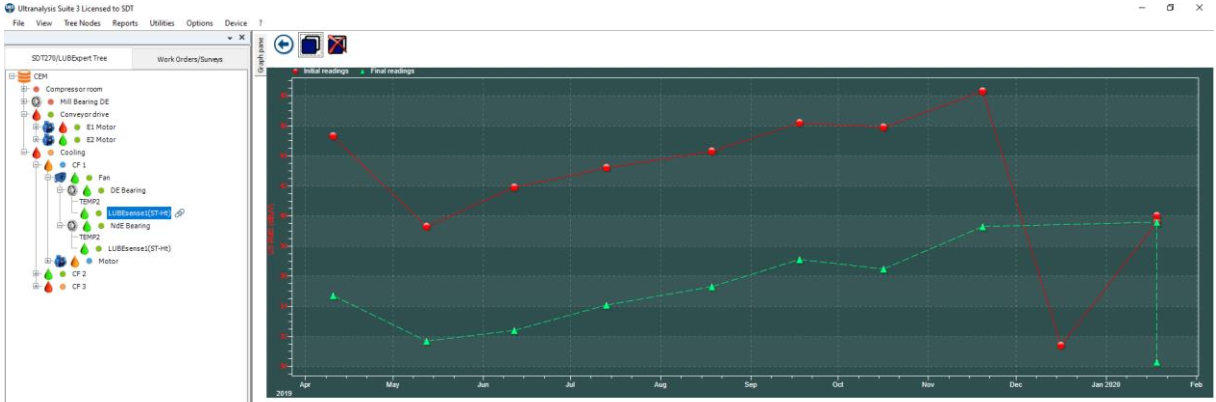
Initial/Base line graph,
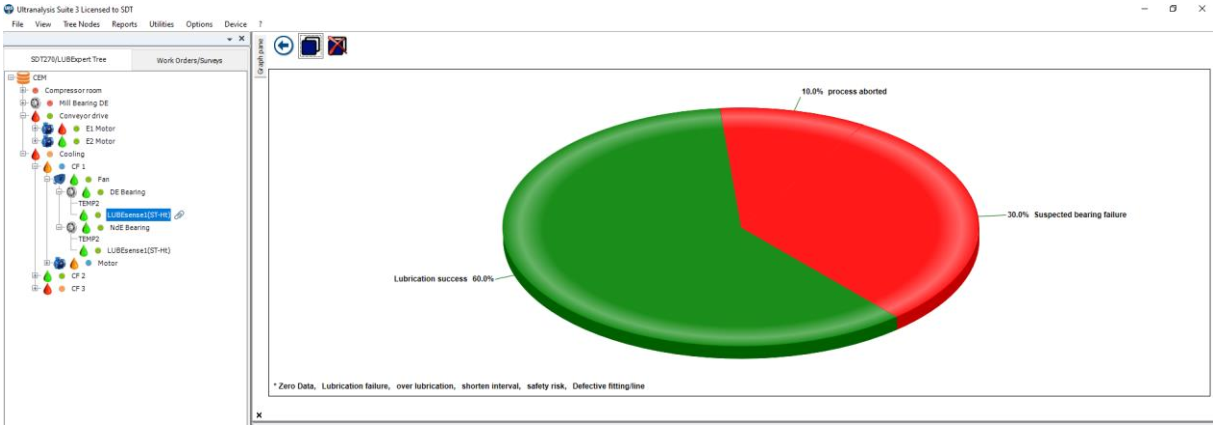
Process statistics

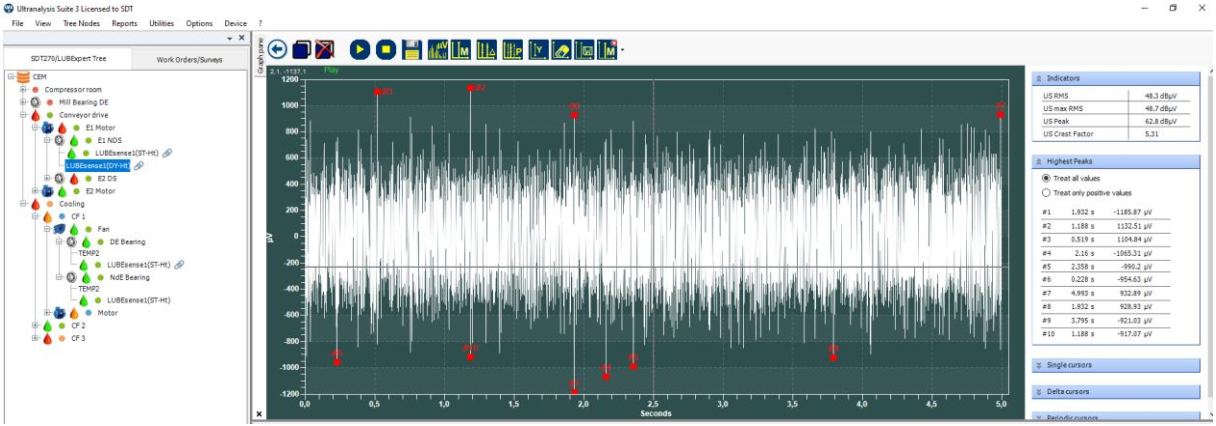
TWF and/or Spectra before and after lubrication (in case you are using LUBExpert Dynamic).
All data relevant to the lubrication process will be displayed.
Examples are showing rotating equipment, but your Asset Condition report is equally useful for electrical equipment, valves, hydraulics, or any other application.