13. Data overview and analysis - Top, Graph, and Bottom Pane
Once collected data is downloaded to UAS3, it should be overviewed, alarms acknowledged, analysis done if needed – data should be used for what their purpose is: better understanding of asset’s condition and extracting actionable conclusions from collected data. Task of UAS3 in that process is to display all collected data in most optimal and useful way and provide tools to work with data.
13.1. Top Pane
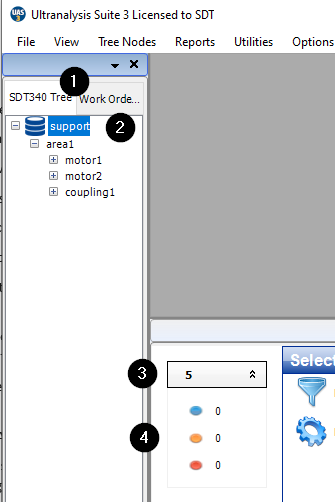
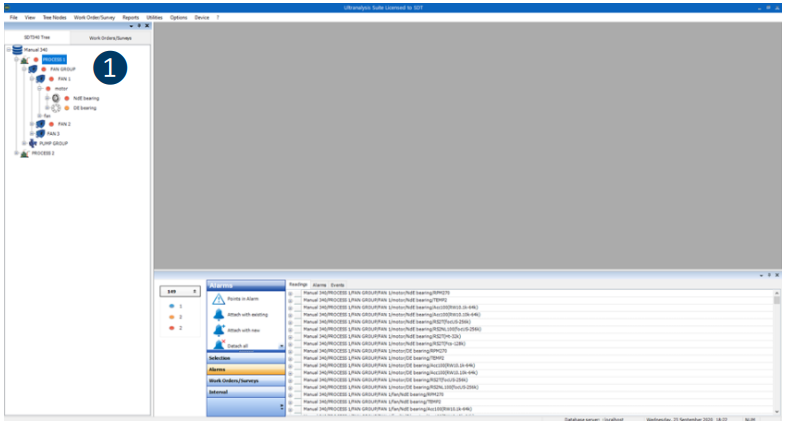
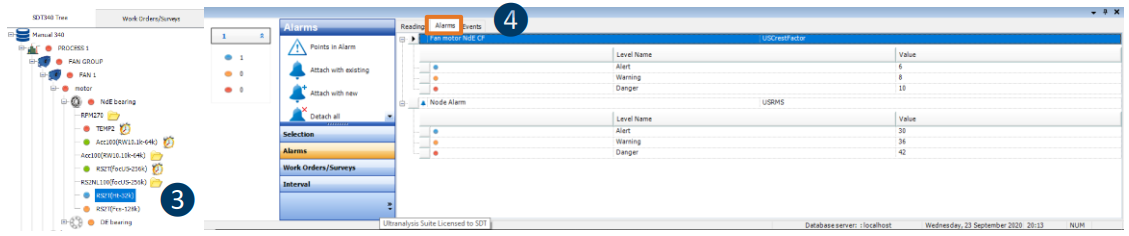
❶ Instrument tab (SDT340 or SDT270/LUBExpert)
❷ Tree Structure in collapsed state
Primary nodes displayed
Alarm indicator active, showing DANGER alarm condition of at least one of the nodes within (in this case) PROCESS 1
❸ Number of measurements within selected Node
❹ Number of measurements in alarm, shown per alarm level, interactively opening measurement (as explained in Managing Alarms section)
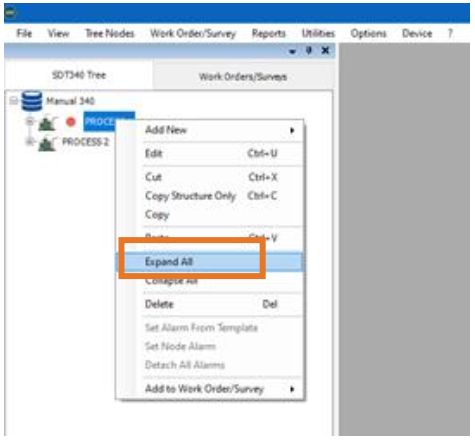
Tree Structure can be fully expanded by selecting Expand All and collapsed by selecting Collapse All.
Both commands apply to selected Node only.
Selecting Nodes, opening child Nodes, or closing to Parent node can also be done using arrows on your keyboard, as follows:
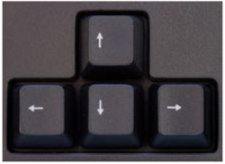
Up – moves selection up through opened items.
Down – moves selection down through opened items.
Right – opens nodes and measurements contained in selected item.
Left – closes nodes and measurements contained in selected item.
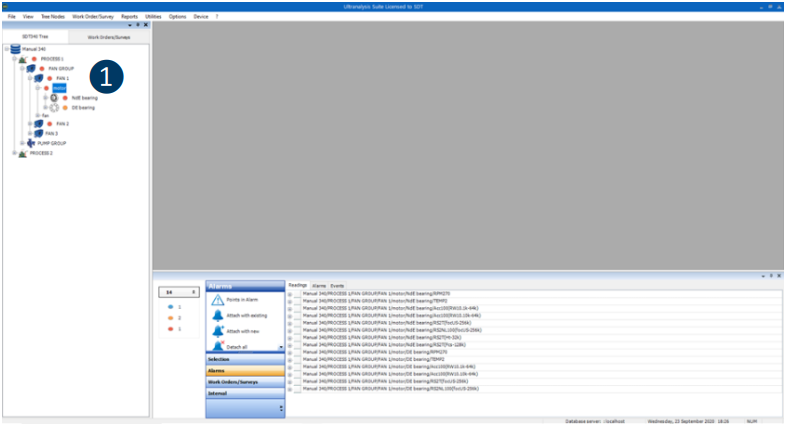
Tree Structure itself contains important additional information:
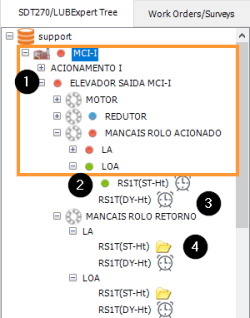
❶ Alarm status of the Node
❷ Alarm status of the measurement, where data triggered alarm
❸ Clock icon indicating that data collection is overdue, based on assigned interval
❹ Folder icon, indicating that measurement point does not contain any data
To display data for each of nodes or measurement, select it and data available for that node or measurement will be displayed in Graph Pane and Bottom Pane:
❶ When Node containing other nodes, but not directly measurements is selected, Graph Pane does not display data, and Bottom Pane displays all measurements within selected Node
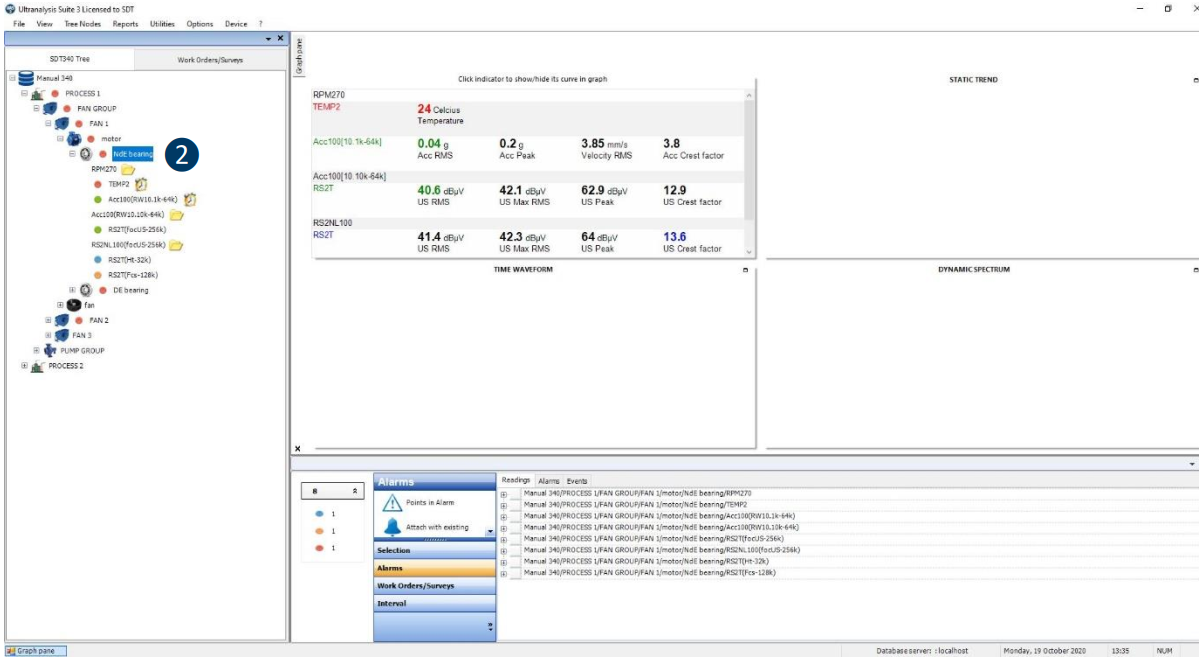
❷ When Node containing measurements is selected, Graph Pane shows Matrix, containing most recent reading for each sensor contained, but not displaying Static Trend Graph, Time domain and Frequency domain. Bottom Pane contains all measurements in selected Node and Events displayed when Events tab is selected.
13.2. Bottom Pane
Bottom Pane contains huge amount of data related to collected data (readings), Alarms and Events. As mentioned above, displayed data depends on selected Node level. At any level higher than measurement point, Bottom Pane will display all measurement points selected Node contains and all Events assigned to selected Node.
13.2.1. Visualization

❶ Node (not measurement) is selected
❷ If Readings tab is selected, Bottom Pane displays all measurement points Node contains

❸ Node (not measurement) is selected
❹ If Events tab is selected, Bottom Pane displays all Events added to selected Node. Event can be edited if right click on selected event
If measurement is selected, Bottom Pane displays all readings and alarms.
Events are not assigned to measurement at the sensor level, but to node (asset, component, or nonrepairable item):
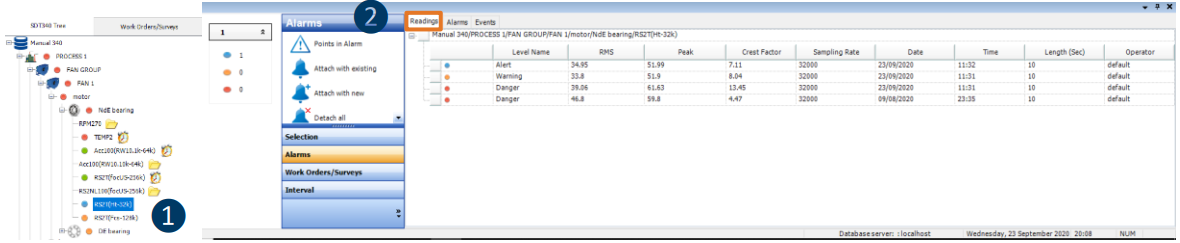
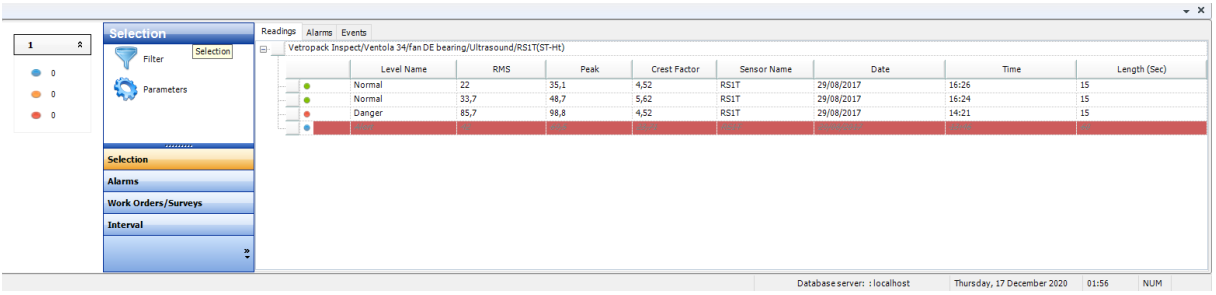
❶ Measurement (sensor level) is selected
❷ If Readings tab is selected, Bottom Pane displays all reading data for all readings unless otherwise set (most recent, in certain period)
❸ Measurement (sensor level) is selected ❹ If Alarms tab is selected, Bottom Pane displays all alarms assigned to this measurement point, including details
13.2.2. Customizing Toolbox
Bottom pane Toolbox provides several tools to apply action on selected items in Bottom Pane. Tools display can be customized by removing or adding tools.
All tools displayed
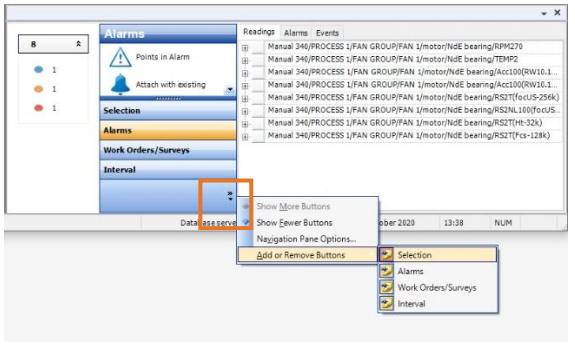
Click on arrow at the bottom to hide or show tools.
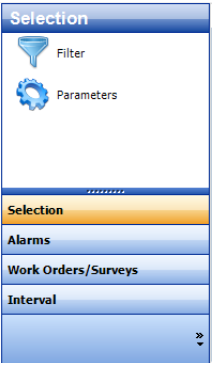
13.2.3. Toolbox - Selection – Parameters
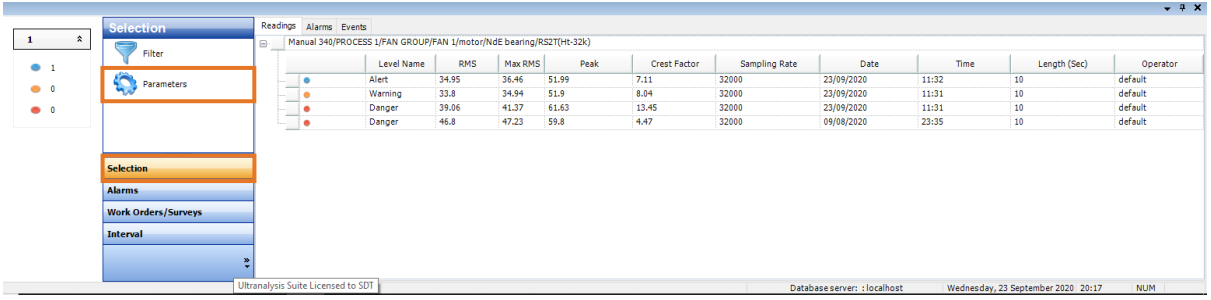
As mentioned, if measurement (sensor level) is selected, Bottom Pane contains reading data.
Exact data to be displayed can be customized by selecting Selection in Bottom Pane toolbar, then selecting Parameters.
Measurement Parameters window will pop up.
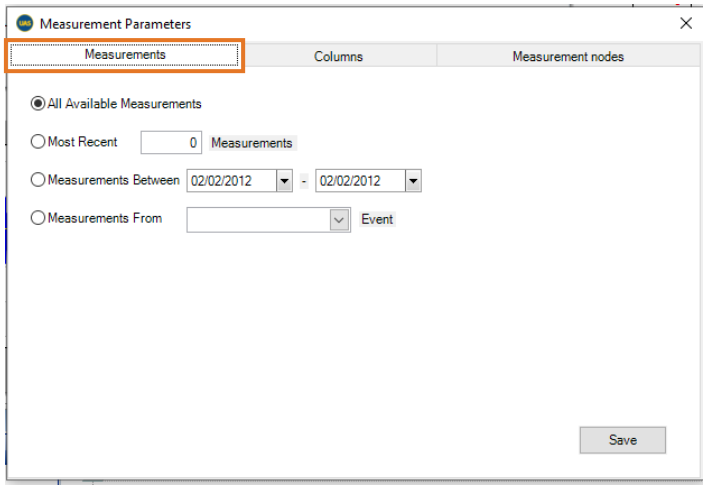
First tab, Measurements, eab les you to define measurements you want to see:
- All Available Meaurements - all measurements will be displayed, entire history
- Most Recent - alo ws you to enter how many most recent measurements should be displayed
- Measurement Between – allows you to set date range to display measurements
- Measurements From – allows you to select event and display measurements only after that event
Second tab, Columns, enables you to define data to be displayed in Bottom Pane. It is slightly different for SDT340, SDT270 and LUBExpert, so both will be explained.
13.2.4. SDT 340 Measurement Parameters/Columns
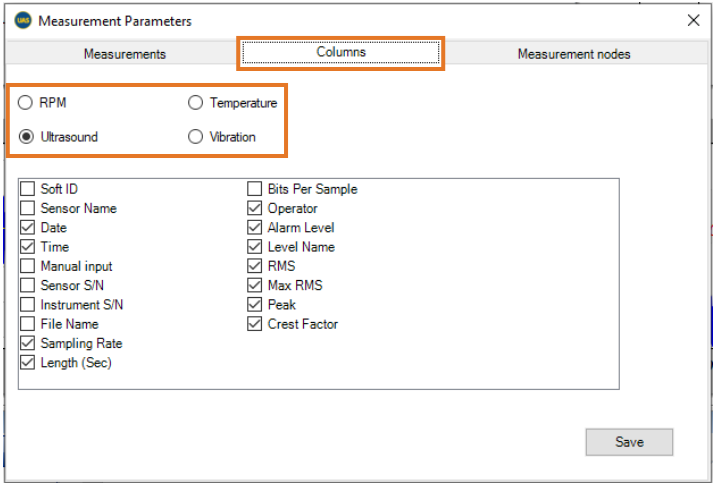
You can decide what to display different data for each sensor. Select sensor (RPM, Temperature, Ultrasound, Vibration) and check all data you want to display in bottom pane. It is a matter of practicality and personal affinity, some users want to see all, some want to see only certain items.
13.2.5. SDT 270 Measurement Parameters/Columns
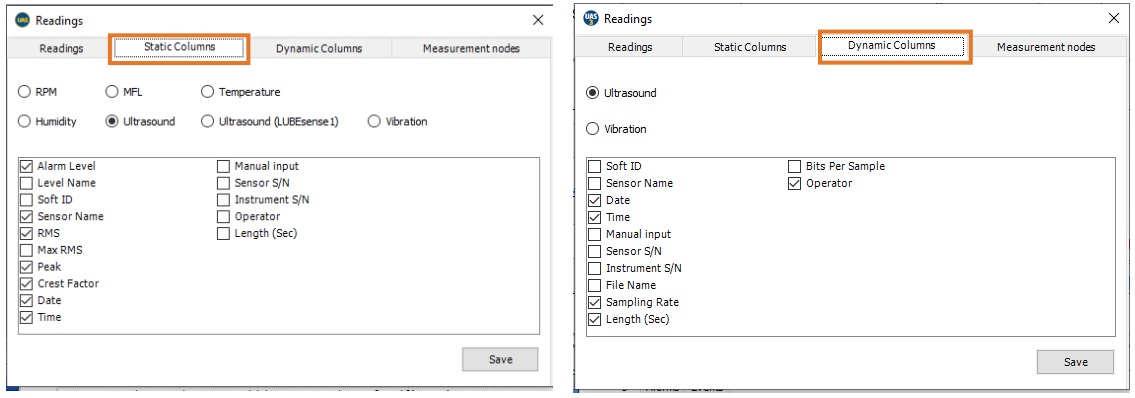
Since measurements in SDT270 and LUBExpert are separate for Dynamic and Static mode, same applies for Columns. In both Static and Dynamic columns settings, select sensor and after that check all data you want displayed. What you see on screen as checked is just a personal affinity, you should customize it any way you find most suitable.
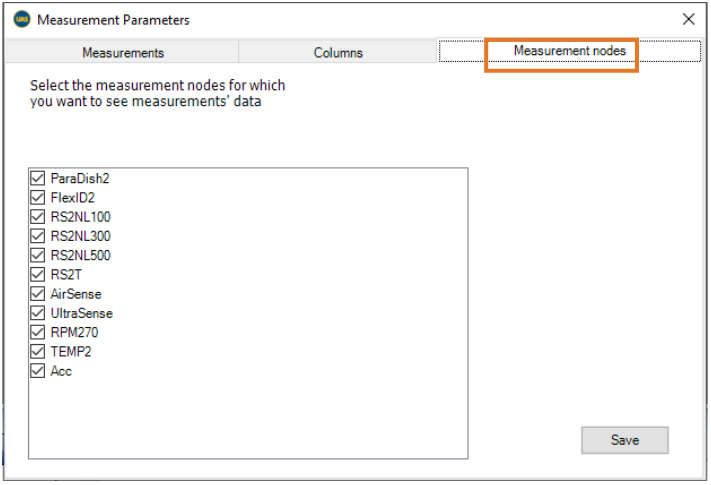
Third tab, Measurements Nodes, enables you to select measurement nodes, sensors, for which measurement data you want to be displayed.
13.2.6. Toolbox - Selection – Filter

Filter function was explained before, in section about creating a Work Order/Survey, as well as in Alarm section. Filter serves a purpose to search group of items based on certain criteria.
Left click on filter and filter bar will appear at the bottom of Bottom Pane, as below:

Enter criteria separated by “;” and no spacing. All items displayed in Bottom Pane will be filtered based on criteria. You can select them individually or multiple (use shift or ctrl) and you can apply other tools on selected group.
13.2.7. Toolbox – Alarms
As already explained in section about alarms, Bottom Pane toolbox contains tools and functionalities to apply alarms on multiple items.
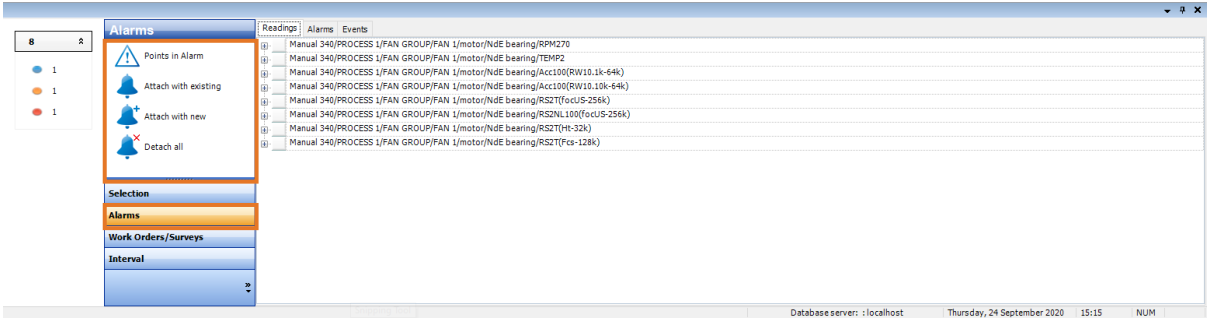
Please refer to Managing Alarms section, where functionalities are explained in detail.
13.2.8. Toolbox – Work Orders/Surveys
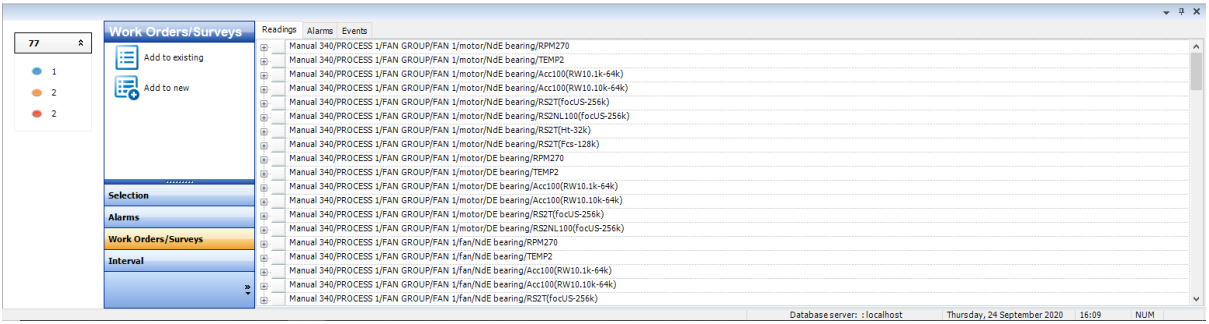
Please refer to Add items from Bottom Pane to Work Order/Survey section.
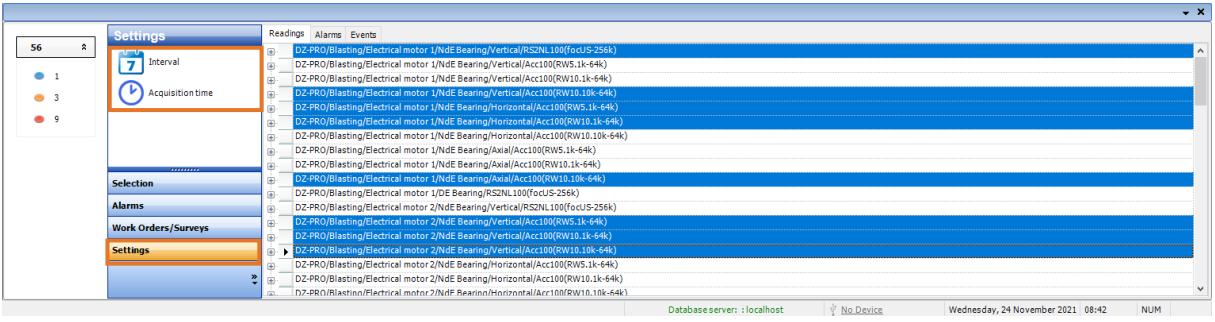
13.2.9. Toolbox – Interval & Acquisition time
As explained previously, setting interval is both mandatory and very useful, enabling numerous other functions as well as making work much easier and better organized. While Interval is set in each measurement point settings individually, in Bottom Pane it can be done both for individual and multiple measurements.
Select items in Bottom Pane you want to apply action to (using Filter or manually), left click on Interval in Bottom Pane toolbox and left click on Set Interval tool. Measurement Interval window will pop up, to set interval.
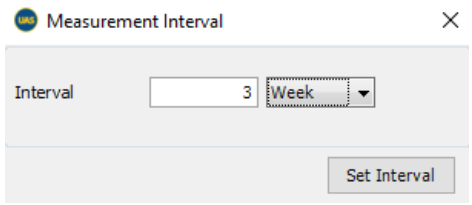
Enter time unit, enter intended interval, and click on Set Interval. Interval is now changed in all selected measurements.
This is very useful function, and it becomes very handy in situations when data shows possible problem or deterioration on some assets, when first action needs to be to shorten the interval.
In the same menu, you can set/change acquisition time for multiple measurement points.
Select a node (asset/group of assets) and select “Settings” and “Acquisition time” in the bottom toolbox.
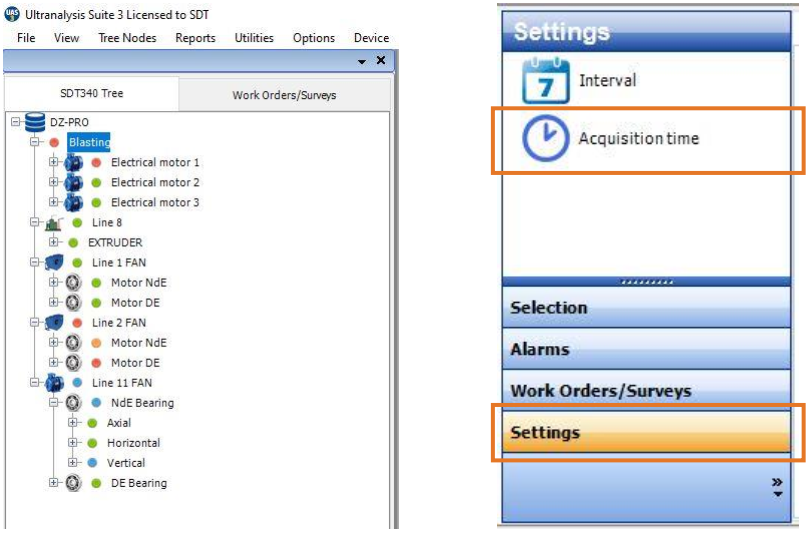
Acquisition time settings menu will pop up:

Select sensor and sampling rate to have all matching measurement settings (nodes) displayed:
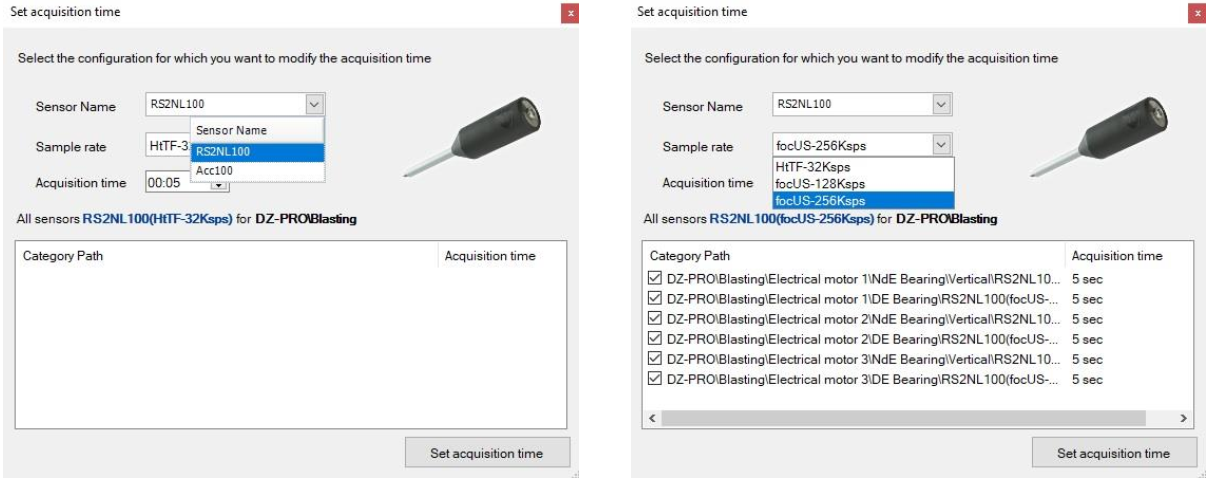
All matching measurement settings will be selected automatically. If you want to change the acquisition time for just some of them, you can de-select them individually. Next, enter the new acquisition time and select the “Set acquisition time” button in the bottom right corner.
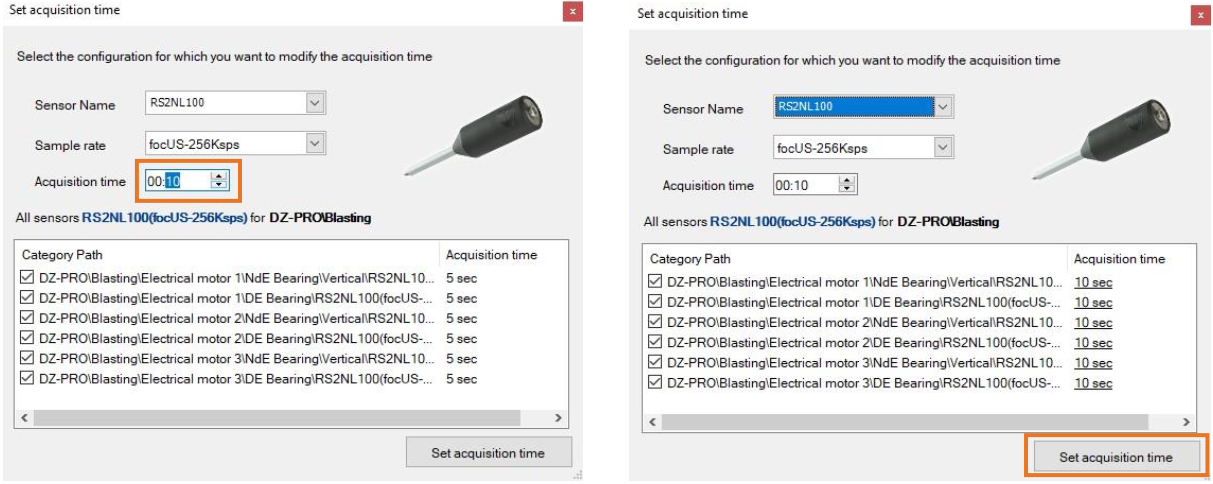
The acquisition time for all selected measurement settings is now set to new value.
13.2.10. Edit, Delete, Exclude from Trend and setting measurement as reference
There are additional actions that can be taken in measurement itself: - Edit - opens measurement details to be overviewed - Mark as Reference – sets measurement as reference, to be used in Relative Alarm settings - Unmark as Reference – cancels the reference setting - Delete – select reading and use “delete” on you keyboard - Colored highlight – warns you that highlighted measurement has different acquisition time than one in current settings - Exclude from Static Trend Graph – this allows you to hide measurement from the graph and it is particularly useful to hide measurement with different acquisition time and have a consistent trend
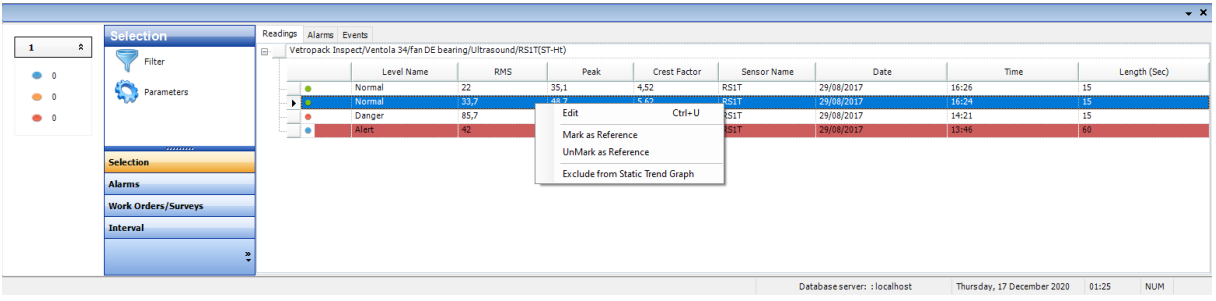
Left click on measurement to select it, then right click to open available functions.
When Edit is selected, window with additional measurement information will pop up, as below:

This window offers some additional information about measurement (amplification, mixer frequency, filter, calibration data ...)
When Mark as Reference is selected, measurement will be marked with no further dialog.
When Unmark as Reference is selected, measurement will be unmarked with no further dialog.
To Delete measurement, left click to select the measurement and press Delete on your PC keyboard and confirmation will be required.

All measurements with different acquisition time than one set in current settings will be highlighted so you can easily spot them.

If necessary, measurements can be hidden in Static Trend Graph (not deleted). For consistency of the trend, excluding measurements with significantly different acquisition time is a good thing to do.
Note that those measurements are not there as a mistake; In certain suspicious situations it is a good practice to collect longer acquisition time data.
To exclude measurement from Static Trend Graph, select the measurement, right click on it and select “Exclude from Static Trend Graph.”

Measurement will be hidden from Static Trend Graph and it will be displayed differently.
At any moment, you can include measurement back to Static Trend Graph following same process.